
Shepherd Community Inc 
The information on this page was last updated 6/8/2026. If you see errors or omissions, please email: [email protected]
Summary
Shepherd's programming is designed to help children and adults build a strong base in four key areas of their lives: physical, emotional, academic and spiritual by providing programs that make up a Continuum of Care.
Building upward stability - Our neighbors on the near eastside of Indianapolis live on the edge of crisis. Shepherd works to build assets into people's lives so they can break the bonds of generational poverty. By fighting systemic causes and serving with life-long, relationship-based care, Shepherd makes a difference - physically, socially, and spiritually.
Serving the community - Shepherd walks alongside our neighbors in every phase of life, meeting people where they are and encouraging them to lives of greater wholeness. We see and serve each person-from newborn babies to students, working families to lonely shut-ins-with wrap-around programs, one-on-one mentoring, and community outreach with a long-term focus.
Supporting pandemic needs - The Coronavirus pandemic continues to deeply impact our neighbors. Food insecurity, job instability, educational upheaval, and isolation are all major issues for the families Shepherd serves. Since March, we've worked hard to implement support and relief, while continuing to build relationships even in a time of social distancing. Our long-term plan for focuses on five key areas of need-Learning, Food, Medical, Connection/Mental Health, and Family Support-critical for helping our community adapt and thrive.
Contact information
Mailing address:
Shepherd Community Inc
4107 East Washington Street
Indianapolis, IN 46201
Website: shepherdcommunity.org
Phone: 317-375-0203
Email: shepherdcommunity.org/connect/
Organization details
EIN: 351765846
CEO/President: Jay Height
Chairman: Ben Lotter
Board size: 12
Founder:
Ruling year: 1988
Tax deductible: Yes
Fiscal year end: 12/31
Member of ECFA: No
Member of ECFA since:
Purpose
At Shepherd, we do life with our neighbors, and see their felt needs first-hand. Some causes of poverty are systemic, and others are situational, but all restrict people's ability to navigate life. Breaking down our preconceived notions and cultural blind-spots is key to achieving real impact in the lives of neighbors living in generational poverty.
As we grow in our understanding of generational poverty, we know that there is no quick fix. Throwing money at the complexity of cultural and systemic issues isn't enough. That's why our relationship-based model focuses on ten key assets that we've found are essential for breaking the cycle of generational poverty.
1. Faith in a personal God who provides purpose and guidance is foundational for hope.
2. Physical health and mobility are key to functioning at school, at work, and within social networks.
3. Relationships provide critical help in times of need, stress, and crisis.
4. Emotional control enables healthy responses to negative circumstances and challenge.
5. Mental acuity in academic skills and critical thinking supports good decision-making.
6. Identifying with stable adults that model stability, planning, and perseverance promotes growth.
7. Self-advocacy-the belief that you can question the status quo and pursue your dreams-empowers change.
8. Knowledge of dominant, mainstream culture helps people succeed and get things done in work and life.
9. Future-orientation supports long-term planning, life-long learning, and perseverance.
10. The money to provide for basic needs such as housing, food, and healthcare is foundational for escaping generational poverty.
Mission statement
Shepherd Community Center's mission is to break the cycle of poverty on the Near Eastside of Indianapolis by engaging and empowering the community to cultivate healthy children, strong families, and vibrant neighborhoods through a Christ-centered approach that meets the spiritual, physical, emotional, and academic needs of our neighbors.
Statement of faith
Donor confidence score
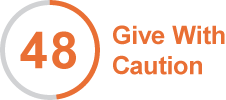
Show donor confidence score details
To understand our donor confidence score, click here.
Transparency grade
D
To understand our transparency grade, click here.
Financial efficiency ratings
Sector: Community Development
| Category | Rating | Overall rank | Sector rank |
| Overall efficiency rating | | 1024 of 1435 | 101 of 148 |
| Fund acquisition rating | | 1156 of 1435 | 111 of 148 |
| Resource allocation rating | | 667 of 1435 | 80 of 148 |
| Asset utilization rating | | 848 of 1436 | 89 of 148 |
According to the organization's Form 990, it received $126,914 in government grants in 2024.
To understand our financial efficiency ratings, click here.
Financial ratios
| Funding ratios | Sector median | 2024 | 2023 | 2022 | 2021 | 2020 |
Return on fundraising efforts Return on fundraising efforts = Fundraising expense / Total contributions | 6% | 10% | 17% | 11% | 16% | 12% |
Fundraising cost ratio Fundraising cost ratio = Fundraising expense / Total revenue | 4% | 8% | 12% | 9% | 11% | 10% |
Contributions reliance Contributions reliance = Total contributions / Total revenue | 91% | 78% | 72% | 78% | 69% | 83% |
Fundraising expense ratio Fundraising expense ratio = Fundraising expense / Total expenses | 5% | 9% | 11% | 11% | 13% | 13% |
Other revenue reliance Other revenue reliance = Total other revenue / Total revenue | 9% | 22% | 28% | 22% | 31% | 17% |
| Operating ratios | Sector median | 2024 | 2023 | 2022 | 2021 | 2020 |
Program expense ratio Program expense ratio = Program services / Total expenses | 83% | 83% | 80% | 84% | 80% | 80% |
Spending ratio Spending ratio = Total expenses / Total revenue | 96% | 83% | 106% | 79% | 82% | 78% |
Program output ratio Program output ratio = Program services / Total revenue | 79% | 69% | 86% | 66% | 65% | 62% |
Savings ratio Savings ratio = Surplus (deficit) / Total revenue | 4% | 17% | -6% | 21% | 18% | 22% |
Reserve accumulation rate Reserve accumulation rate = Surplus (deficit) / Net assets | 4% | 15% | -4% | 18% | 13% | 20% |
General and admin ratio General and admin ratio = Management and general expense / Total expenses | 11% | 7% | 8% | 5% | 7% | 8% |
| Investing ratios | Sector median | 2024 | 2023 | 2022 | 2021 | 2020 |
Total asset turnover Total asset turnover = Total expenses / Total assets | 1.02 | 0.68 | 0.65 | 0.63 | 0.56 | 0.67 |
Degree of long-term investment Degree of long-term investment = Total assets / Total current assets | 1.89 | 1.39 | 1.58 | 1.27 | 1.21 | 1.25 |
Current asset turnover Current asset turnover = Total expenses / Total current assets | 2.14 | 0.95 | 1.02 | 0.80 | 0.68 | 0.83 |
| Liquidity ratios | Sector median | 2024 | 2023 | 2022 | 2021 | 2020 |
Current ratio Current ratio = Total current assets / Total current liabilities | 12.56 | 19.89 | 18.41 | 29.04 | 17.03 | 20.38 |
Current liabilities ratio Current liabilities ratio = Total current liabilities / Total current assets | 0.07 | 0.05 | 0.05 | 0.03 | 0.06 | 0.05 |
Liquid reserve level Liquid reserve level = (Total current assets - Total current liabilities) / (Total expenses / 12) | 4.79 | 12.03 | 11.09 | 14.41 | 16.65 | 13.71 |
| Solvency ratios | Sector median | 2024 | 2023 | 2022 | 2021 | 2020 |
Liabilities ratio Liabilities ratio = Total liabilities / Total assets | 10% | 5% | 4% | 4% | 5% | 4% |
Debt ratio Debt ratio = Debt / Total assets | 0% | 1% | 0% | 0% | 0% | 0% |
Reserve coverage ratio Reserve coverage ratio = Net assets / Total expenses | 77% | 140% | 148% | 152% | 170% | 143% |
Financials
| Balance sheet | |||||
| Assets | 2024 | 2023 | 2022 | 2021 | 2020 |
| Cash | $1,139,569 | $1,707,578 | $3,865,465 | $3,327,267 | $1,931,158 |
| Receivables, inventories, prepaids | $3,781,125 | $366,077 | $780,209 | $471,564 | $1,076,981 |
| Short-term investments | $7,098,766 | $6,606,675 | $5,672,815 | $6,388,371 | $5,441,753 |
| Other current assets | $0 | $0 | $0 | $0 | $0 |
| Total current assets | $12,019,460 | $8,680,330 | $10,318,489 | $10,187,202 | $8,449,892 |
| Long-term investments | $2,045,907 | $2,565,004 | $624,905 | $735,968 | $883,202 |
| Fixed assets | $2,401,032 | $2,122,442 | $1,839,929 | $1,415,001 | $1,162,225 |
| Other long-term assets | $271,322 | $321,361 | $370,780 | $33,234 | $28,234 |
| Total long-term assets | $4,718,261 | $5,008,807 | $2,835,614 | $2,184,203 | $2,073,661 |
| Total assets | $16,737,721 | $13,689,137 | $13,154,103 | $12,371,405 | $10,523,553 |
| Liabilities | 2024 | 2023 | 2022 | 2021 | 2020 |
| Payables and accrued expenses | $604,180 | $471,446 | $355,300 | $376,210 | $309,884 |
| Other current liabilities | $0 | $0 | $0 | $222,028 | $104,804 |
| Total current liabilities | $604,180 | $471,446 | $355,300 | $598,238 | $414,688 |
| Debt | $176,272 | $35,475 | $55,380 | $0 | $0 |
| Due to (from) affiliates | $0 | $0 | $0 | $0 | $0 |
| Other long-term liabilities | $6,790 | $54,167 | $117,846 | $6,252 | $18,756 |
| Total long-term liabilities | $183,062 | $89,642 | $173,226 | $6,252 | $18,756 |
| Total liabilities | $787,242 | $561,088 | $528,526 | $604,490 | $433,444 |
| Net assets | 2024 | 2023 | 2022 | 2021 | 2020 |
| Without donor restrictions | $3,159,594 | $4,424,506 | $4,834,847 | $3,792,159 | $2,358,970 |
| With donor restrictions | $12,790,885 | $8,703,543 | $7,790,730 | $7,974,756 | $7,731,139 |
| Net assets | $15,950,479 | $13,128,049 | $12,625,577 | $11,766,915 | $10,090,109 |
| Revenues and expenses | |||||
| Revenue | 2024 | 2023 | 2022 | 2021 | 2020 |
| Total contributions | $10,677,408 | $6,051,071 | $8,169,447 | $5,863,952 | $7,540,032 |
| Program service revenue | $2,648,710 | $2,225,277 | $2,082,738 | $1,868,804 | $1,305,091 |
| Membership dues | $0 | $0 | $0 | $0 | $0 |
| Investment income | $390,506 | $80,190 | $272,204 | $708,767 | $187,533 |
| Other revenue | $0 | $0 | $12,967 | $10,177 | $0 |
| Total other revenue | $3,039,216 | $2,305,467 | $2,367,909 | $2,587,748 | $1,492,624 |
| Total revenue | $13,716,624 | $8,356,538 | $10,537,356 | $8,451,700 | $9,032,656 |
| Expenses | 2024 | 2023 | 2022 | 2021 | 2020 |
| Program services | $9,492,052 | $7,148,821 | $6,935,166 | $5,494,704 | $5,596,194 |
| Management and general | $834,875 | $736,306 | $435,554 | $501,601 | $555,090 |
| Fundraising | $1,064,566 | $999,216 | $924,727 | $915,129 | $884,099 |
| Total expenses | $11,391,493 | $8,884,343 | $8,295,447 | $6,911,434 | $7,035,383 |
| Change in net assets | 2024 | 2023 | 2022 | 2021 | 2020 |
| Surplus (deficit) | $2,325,131 | ($527,805) | $2,241,909 | $1,540,266 | $1,997,273 |
| Other changes in net assets | $0 | $0 | $0 | $0 | $0 |
| Total change in net assets | $2,325,131 | ($527,805) | $2,241,909 | $1,540,266 | $1,997,273 |
Compensation
| Name | Title | Compensation |
| Jay Height | Executive Director | $156,991 |
| Tim Sturgess | Chief Administrative Officer (part year) | $149,247 |
| Andrew Green | Asst. Executive Director | $119,995 |
Compensation data as of: 12/31/2024
Response from ministry
No response has been provided by this ministry.
The information below was provided to MinistryWatch by the ministry itself. It was last updated 6/8/2026. To update the information below, please email: [email protected]
History
Program accomplishments
Needs
When you give to Shepherd Community Center, you make a difference in the lives of the children, families, and neighbors we serve. Your gift helps to feed, educate, and care for your neighbors, providing a continuum of relationship-based care.